The charge and discharge at constant power PL represent conditions closer to most parts of the applications. Special care must be brought to low-voltage conditions where the current is very large. In this situation, the Joule losses are proportionally bigger, which results in a much smaller efficiency.
To interpret the results, it is necessary to solve a more difficult differential equation for the voltage on the capacitor part Uc(t) (the voltage at the supercapacitor terminal U = UL, is equal to Uc(t) + Rs i(t)).
The capacitance of a supercapacitor increases with the voltage. If the capacitance is defined as C = C0+ KUc, the relation between the current and the voltage variation during a discharge is given by

The voltage as a function of time at constant power delivery −PL is given by the literal resolution of the following differential equation 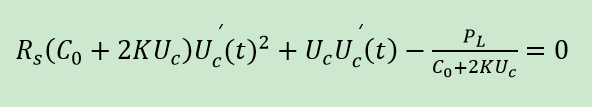 The solution is obtained after a (Uc,t) variable separation and an integration and is given by
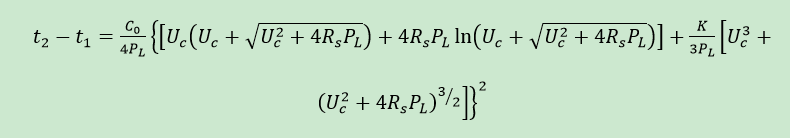
For a typical supercapacitor specified 1 kg, C = 6000 F and Rs= 0.1 mΩ, the charging and discharging voltage curves at constant power PL= 2000W are shown in Figure 1.1 An acceleration of the discharge occurs when the voltage drops. The phenomenon is amplified by the capacitance drop.
On the Ragone plot, the discharge at constant power will be represented by a vertical line, starting on the Ragone curve corresponding to the initial voltage (nominal voltage is typically equal to 2.7 V) and ending on the Ragone curve for half the initial voltage.
To get a constant power during the discharge between Un and Un/2, the maximum power must be at least four times smaller than Pm. In the example shown in Figure 1.2, the maximum power could be only 1800Wkg−1.
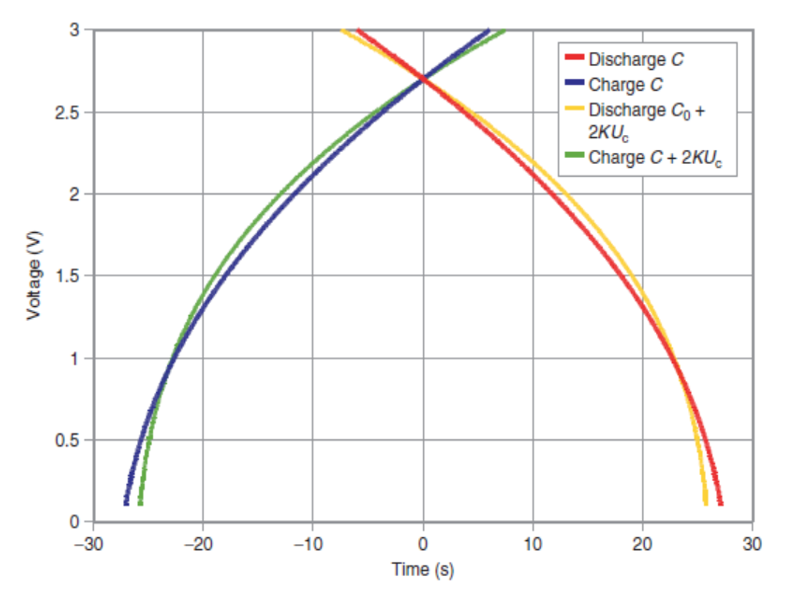
Figure-1.1-Two-kilowatt-constant-power-charge-and-discharge-of-a-supercapacitor
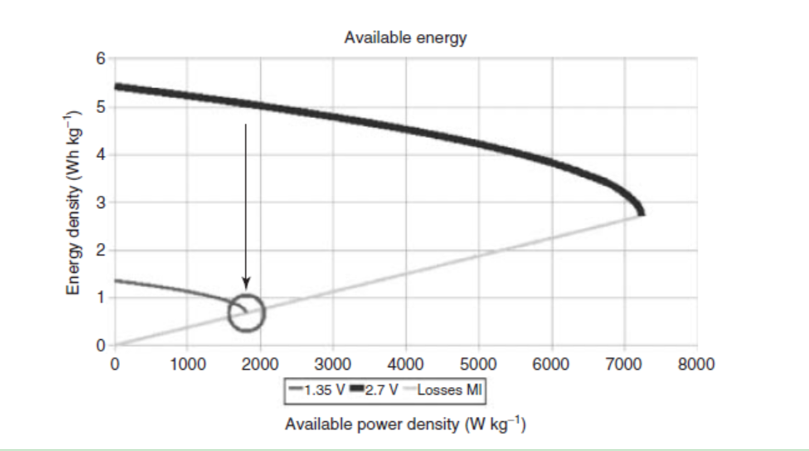
Figure-1.2-Linear-drop-in-the-maximum-power-Pm-as-a-function-of-the-voltage-drop
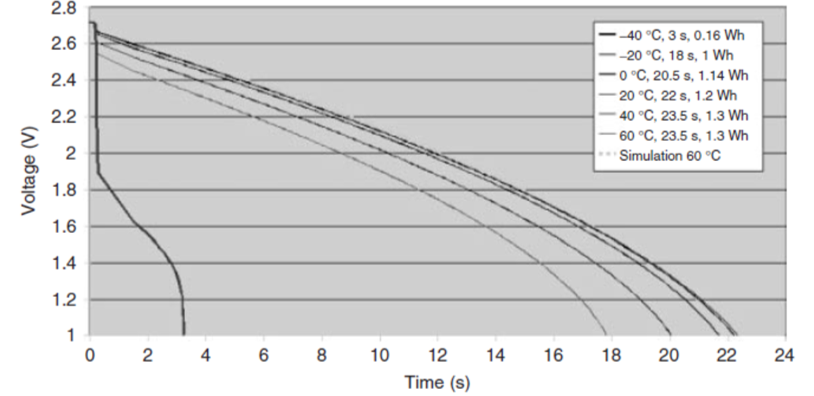
Figure-1.3-1500F-cell-200-W-constant-power-discharge-for-different-temperatures
For a given available power, the losses increase when the voltage falls because the current increases to compensate the smaller voltage value to maintain the power. The efficiency decreases with the voltage during the discharge.
To get a constant current discharge between the two same voltage limits, it is necessary to limit the initial power to twice the final one: in this example 3600Wkg−1.
A verification of the theory has been performed on 1500F and 2600F supercapacitors (Figures 1.3 and 1.4). The 1500F cell is a power version with a thinner electrode in order to reduce the series resistance. Thanks to the low solvent viscosity of the electrolyte, in this case AN, it is still possible to get some power at temperature as low as −40 ◦C.
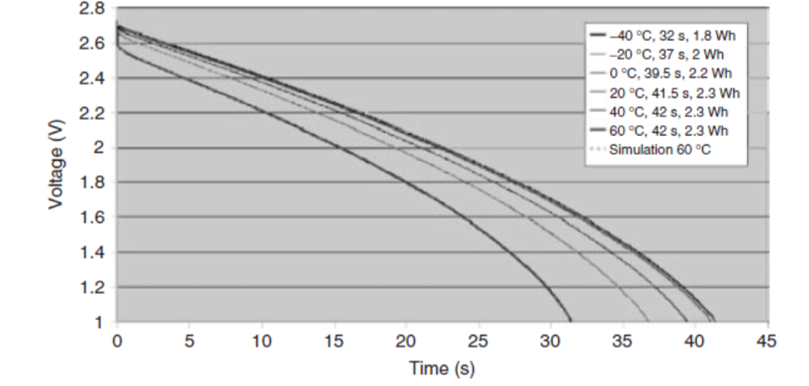
Figure-1.4-2600F-cell-200-W-constant-power-discharge-for-different-temperatures..png
At the end of the discharge, the voltage drop is faster. This is due to the supercapacitor’s smaller energy content at low voltage. The initial voltage step is due to the voltage drop in the series resistance when the current is turned on. The step is very important in the smaller supercapacitor at −40 ◦C. This may be due either to internal problems as a result of the construction or the experimental setup. In any case, it is essential that the total series resistance remains as low as possible to get a good function of the supercapacitor.
The capacitance and the series resistance parameters have been determined with the relation developed theoretically (Eq. (1.3)) by fitting the experimental curves obtained when measuring the voltage evolution during a discharge at 200 W constant power (Table 1.1).
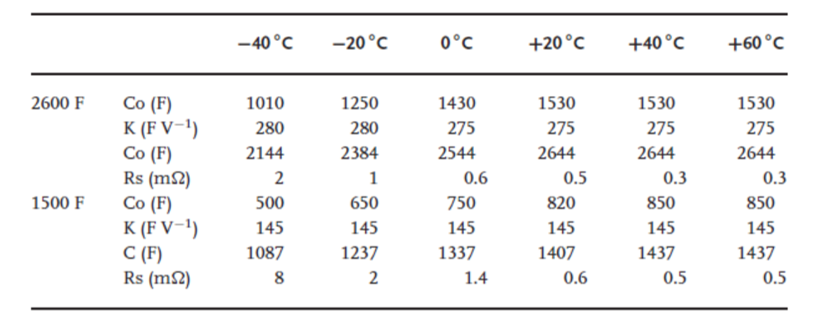
Table-1.1-1500F-and-2600F-supercapacitor-parameters used to fit the experimental 200W discharge vurves at different temperature.
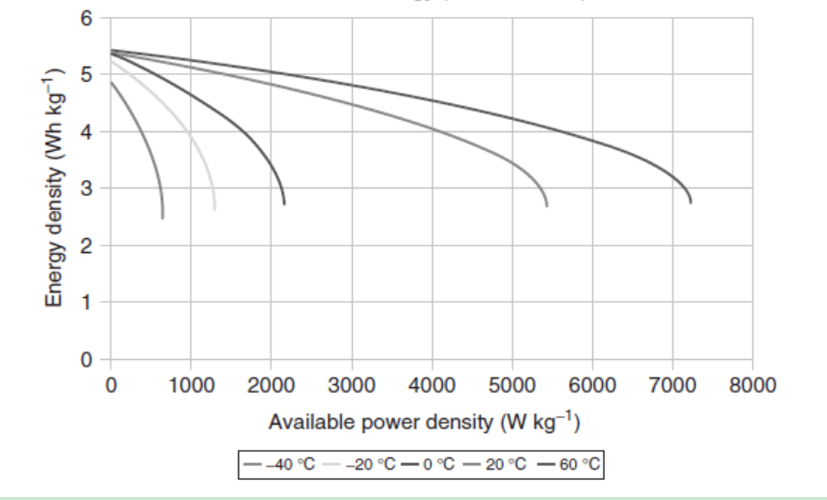
Figure-1.5-1500F-cell-Ragone-plot-for-different-temperatures.png
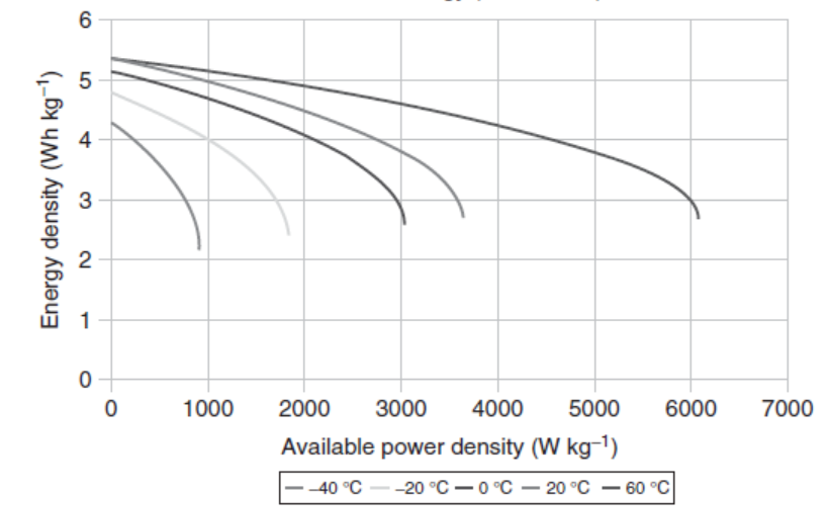
Figure 1.6 2600F Ragone plot for different temperature
The experimental measurements have been performed on both supercapacitors with the same 200 W constant power (Figures 1.5 and 1.6). In the 280 g 1500F cell, the power density of the discharge is higher than in the 500 g 2600F cell: 714 W kg−1 against 400 W kg−1. At low temperatures, the match impedance is overcome in the small 1500 F supercapacitor. The Ragone plot curves have been obtained with other equation, which depends only on Rs and C, parameters that are supposed to have been measured with low current, which is far from the truth, especially in the case of the 1500 F supercapacitor.
—– Quote from:《Supercapacitors: Material, System, and Applications》
Energetic Performance and Discharging at Constant Power
About SPS
Supreme Power Solutions Co., Ltd. (SPS) is a leading manufacturer of ultracapacitors, as well as a provider of ultracapacitor energy storage systems and technological solutions. Our products have wide industry applications, such as new energy vehicles, wind turbines pitching control systems, trams and subways, smart grid, micro grid, heavy duty machineries, intelligent instrument, etc. We support more than 200 customers, and our products are exported to 26 countries and territories.
More information:https://www.spscap.com
